

“Weak people run from new ideas, or so it seems, and then are driven into bizarre mind states, such as believing that words have the power to dominate reality, that social constructs such as gender are much stronger than the 300 million years of genetic evolution that went into producing the two sexes.”
This is the latest post in my “12 Things Everyone Should Know” series. You can access the full collection here.
To mark the publication of my third book, A Billion Years of Sex Differences, I’m releasing a post I’ve had in mind for several years, but that I thought I should save until the book was out: 12 Things Everyone Should Know About Sex Differences.
Few topics in psychology generate more heat than this one, but few are backed by a larger body of scientific evidence. The aim of this post is to highlight some of the best-established differences in the scientific literature, and what the research says about their origins. Are they due solely to culture, or is there also an innate component? If the latter, why did the innate component evolve?
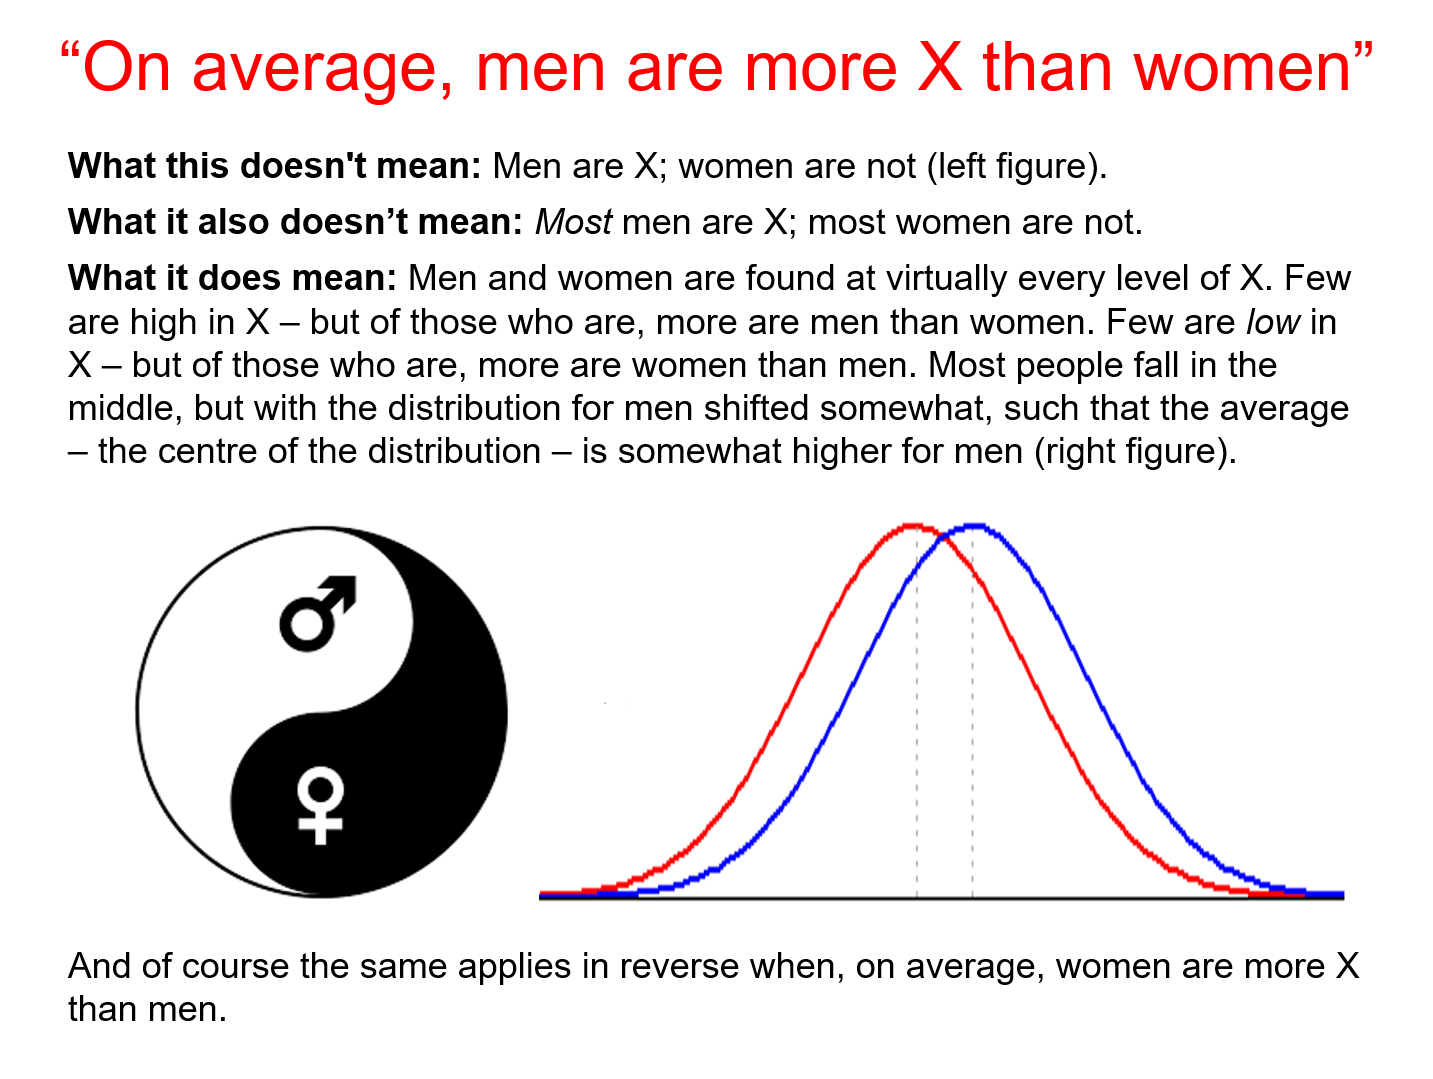
Before getting started, though, a warning: It’s easy to misunderstand claims about sex differences. The image below explains what scientists mean - and what they don’t mean - when they say that, on average, men score higher than women on a given trait (or vice versa).
With that in mind, let’s start our exploration of some of the key findings from the science of sex differences.
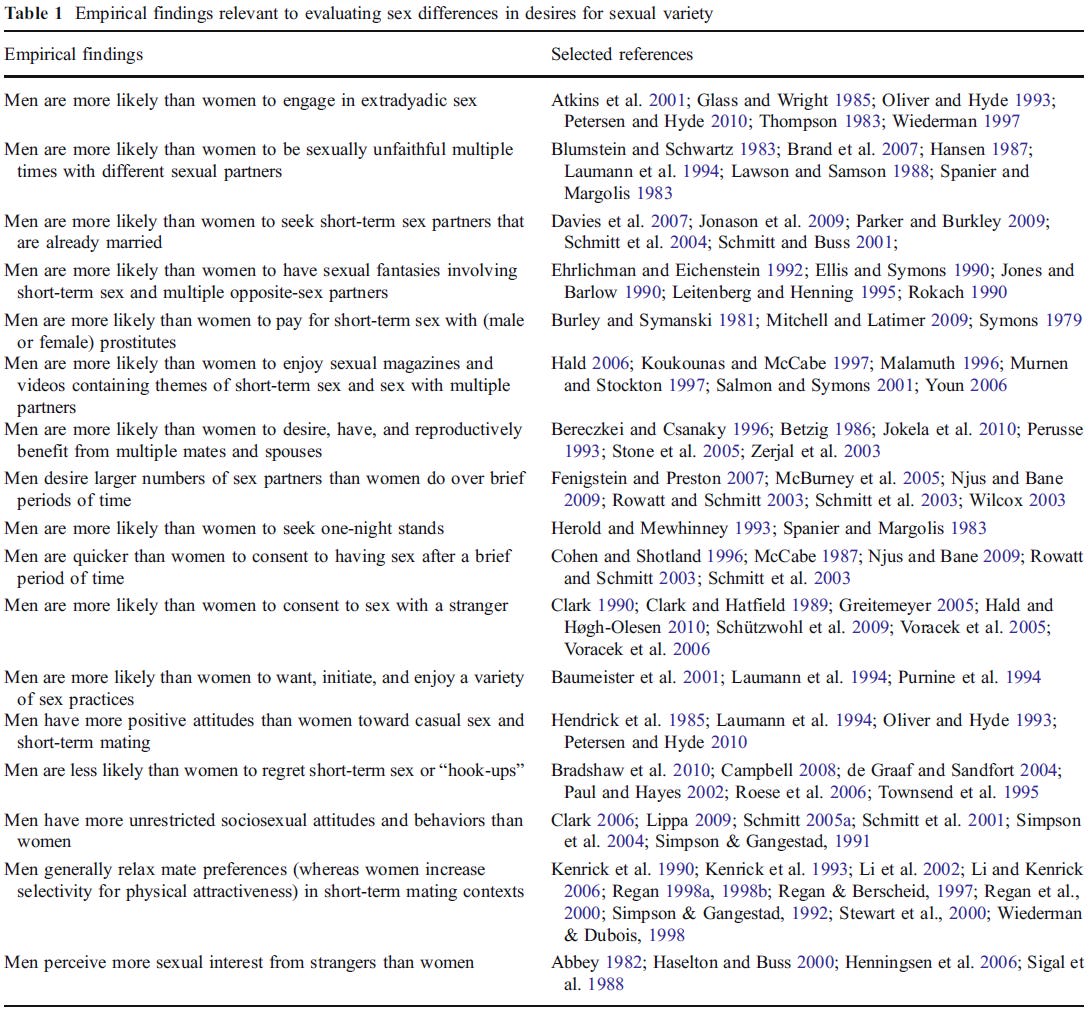
1. On average, men are more interested than women in casual sex and sexual variety. Note that this isn’t to say that “Men are promiscuous, women monogamous”; it’s an average difference, not a categorical one. The table below summarizes some of the voluminous evidence that the sexes differ in this domain.
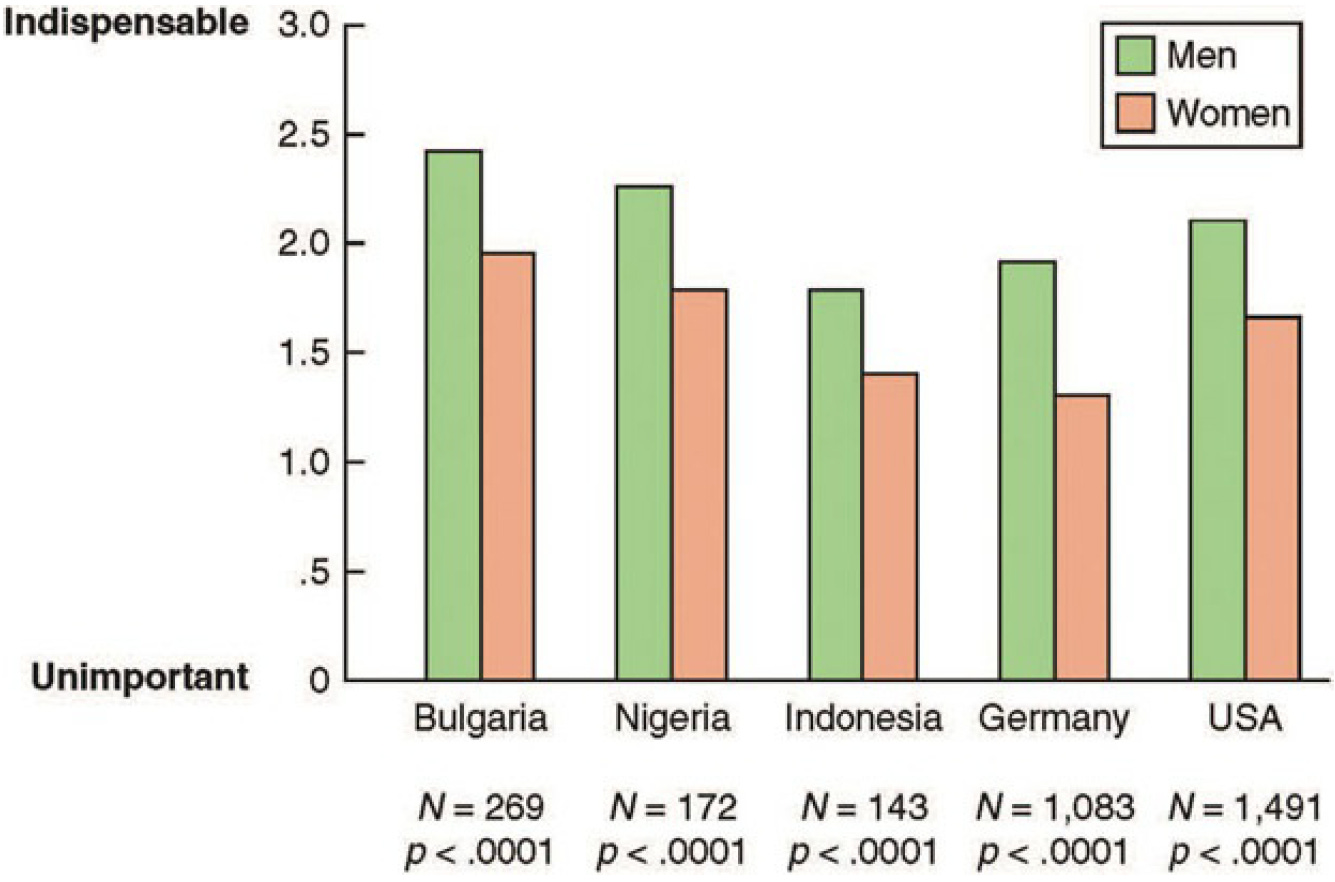
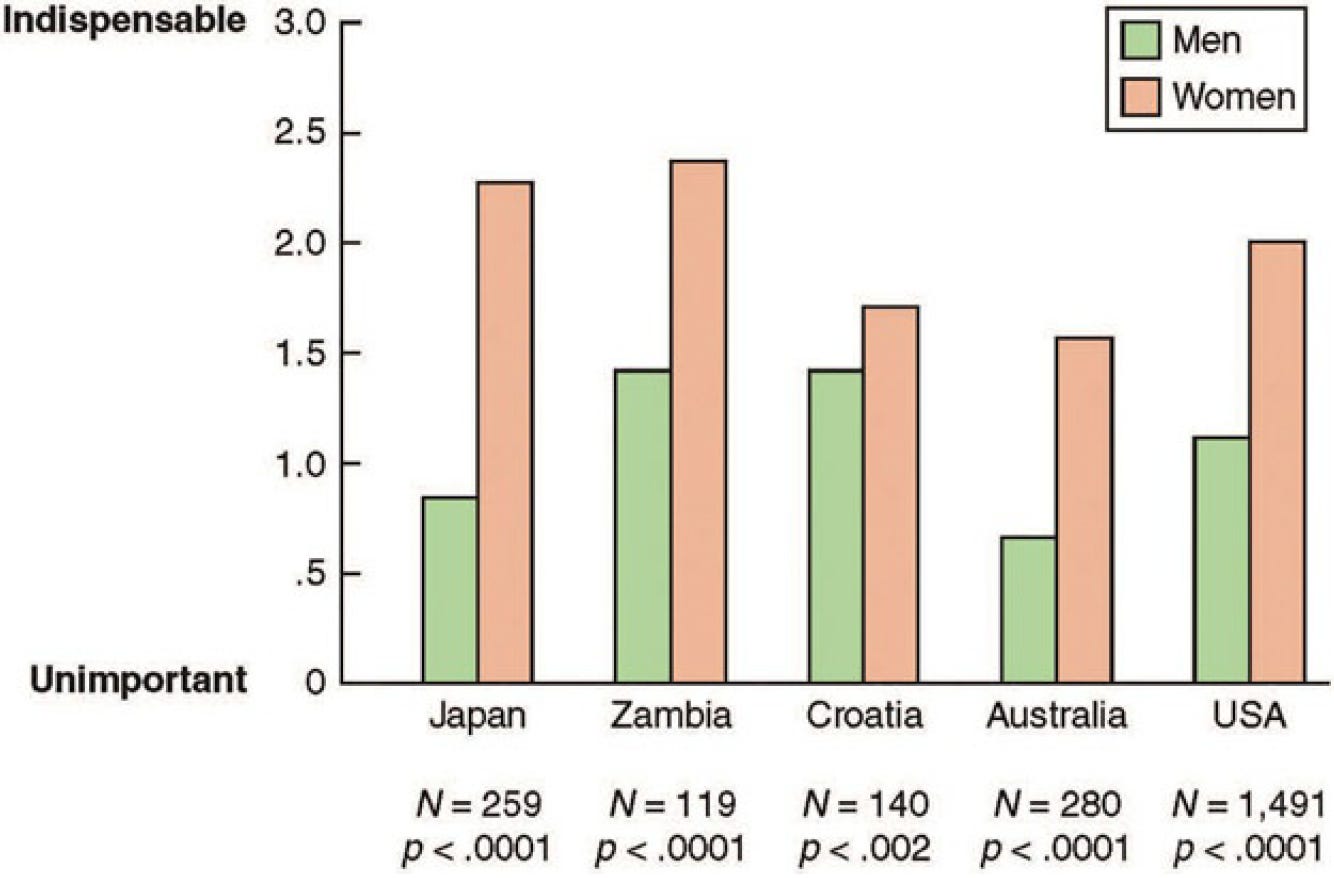
2. On average, men place more weight than women on a long-term mate’s looks - see the first graph below. Women, in contrast, place more weight than men on a mate’s wealth and status - see the second graph below. Both differences are found in all or almost all nations; the graphs just show a representative sample.