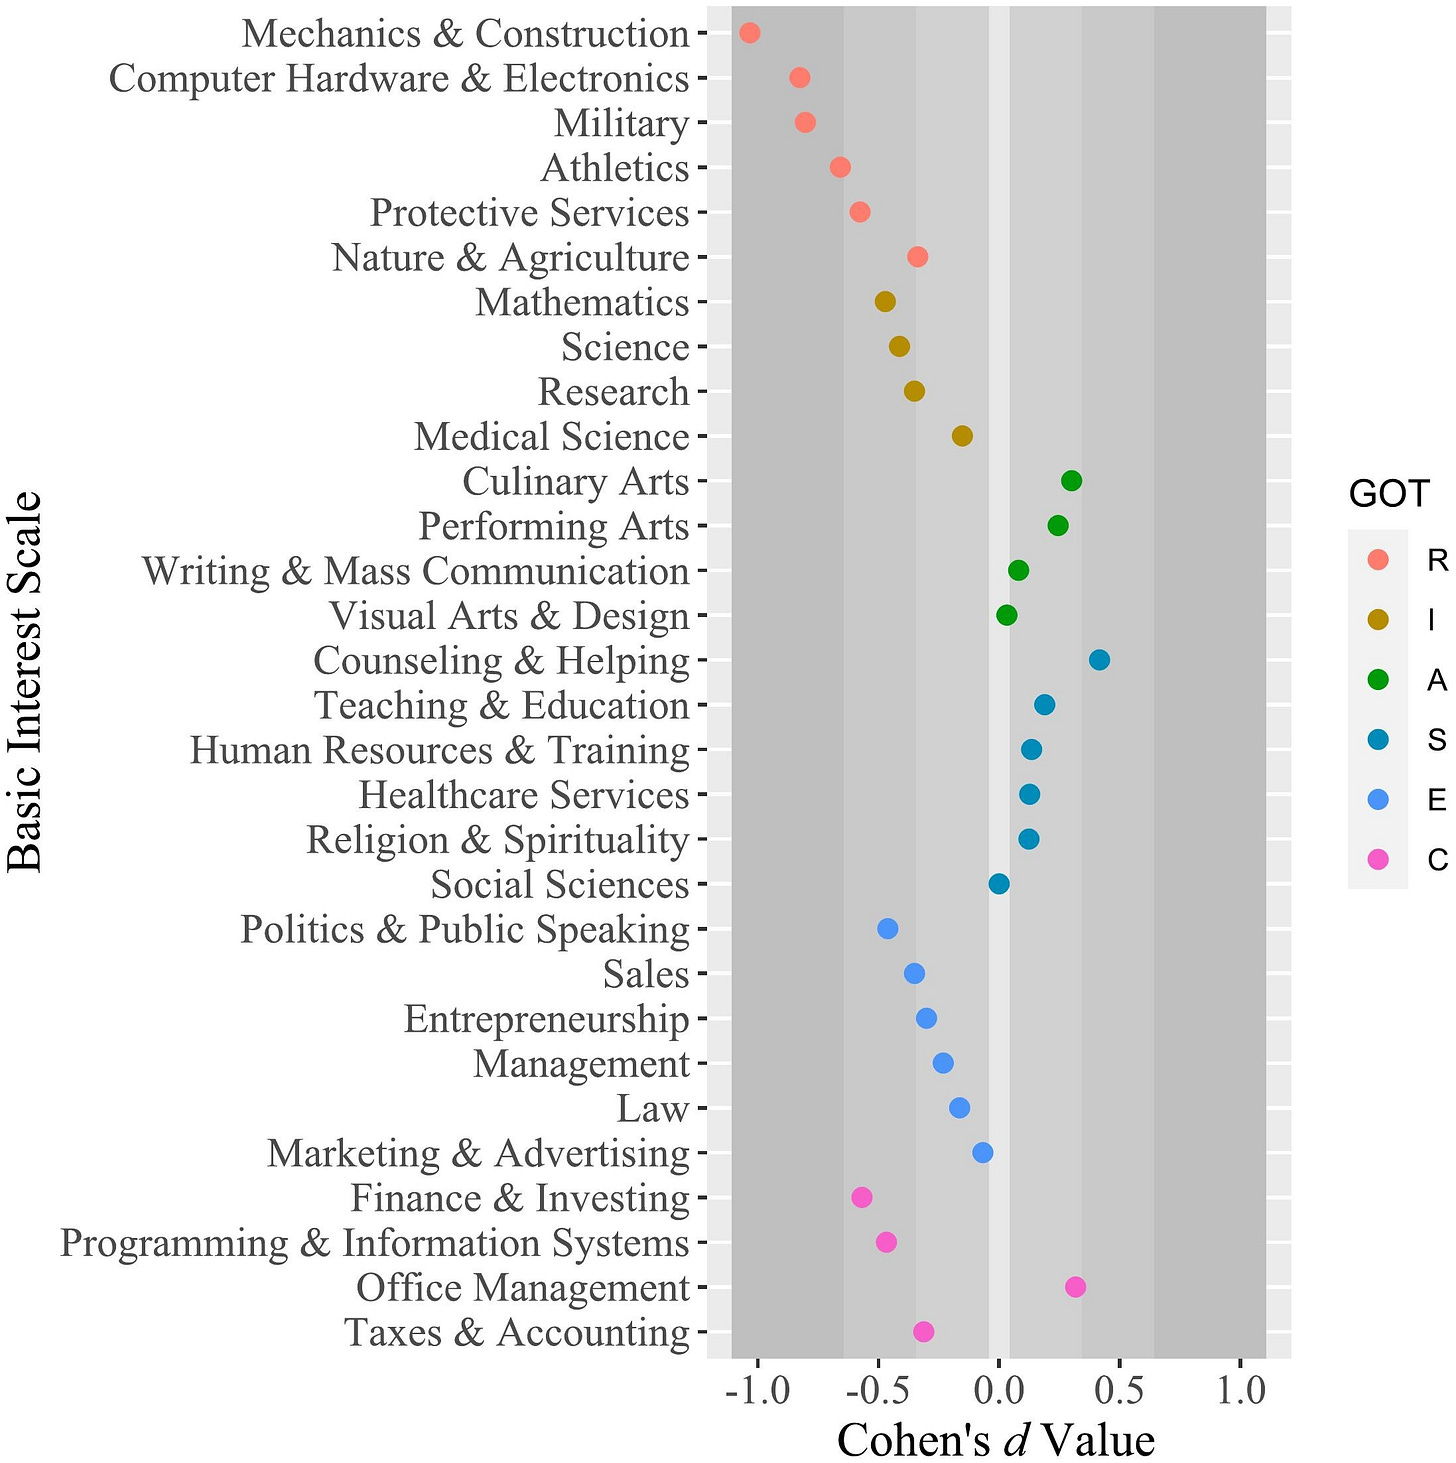
Graph of the Day: Sex Differences in Vocational Interests
Which jobs interest more men than women, and which more women than men?
The graph below shows average sex differences in basic vocational interests in a large U.S. sample (N = 1,283,110). Values below 0 indicate that men are more interested; values above 0 indicate that women are more interested. These are average differences, of course, rather than categorical ones; there’s plenty of variation in vocational interests within each sex and overlap between the sexes.
RIASEC refers to the broad categories of vocational interests used in most research on this topic. R = Realistic; I = Investigative; A = Artistic; S = Social; E = Enterprising; C = Conventional.
The graph is from a new paper by Kevin Hoff and colleagues. Here’s the abstract:
Research on vocational interests has played an important role in understanding workforce gender disparities. However, current understanding about gender differences in interests is primarily limited to broad RIASEC interest categories that average together differences in narrower interest scales. This study took a refined approach to examine gender differences in 30 basic vocational interests (e.g., medical science, management, social science) using a very large and diverse U.S. sample (N = 1,283,110). Results revealed that gender differences in basic interests are more complex than what can be captured using broad interests alone. There was meaningful variability in the size and direction of mean gender differences across basic interests, even those related to the same RIASEC category. Turning to the labor market, we found that gender differences in basic interests showed high convergence with men and women’s employment rates in corresponding occupations (r = 0.66). Despite this convergence, there were also discrepancies such that women’s actual employment fell short of interest-based predictions in many high-status occupations and in jobs that involve working with machinery. In contrast, fewer men were employed in prosocial occupations than predicted based on their interests. Finally, we examined how gender differences in basic interests varied across intersecting age, ethnicity, and education subgroups. The most striking finding was that gender differences in interests were considerably larger at lower education levels, pointing to specific educational tracks where applied initiatives might have the greatest impact in improving gender representation in the workforce.


You might look into supersectors from BLS which aggregates industries in a much more balanced way:
Mining & Logging
Construction
Manufacturing
Trade-Transport-Utilities
Information
Financial Activities
Professional & Business Services
Education & Health Services
Leisure & Hospitality
Several of these were blips in 1950, and today far outsize Construction or Manufacturing - Professional Services, Leisure, Education - I don’t even know how to classify Professional & Business Services in RIASEC but I can sure say that they attract and retain a lot of very highly paid women.
The thing that makes me the most curious is who generated the vocational classification system. I routinely use NAICS in industrial benchmarking, it generally works unless industries are clustered, for instance computers and software are often part of the same company, and more and more equipment has computer controllers. In this index programming and computer systems are at opposite ends… “office management” appears aligned with computing. Curious!
I looked at the RIASEC codes, they were generated in 1958, people were to be one of six “types”, and so on. I’ll go out on a limb and say vocational analysis frameworks generated in 1958 by a man born in 1919 may not be totally relevant to 2023. Men’s labor participation rate was almost three times that of women in this period, there was the concept of a “secretarial pool”, a human-usable computer keyboard was being developed.
I’d be much more interested in a classification system updated to the 21st century, and clustered based using less biased semantic cluster analysis of work/job description.
All this seems to do is reproduce an anachronistic set of job biases; I’d be fascinated to have a set of 20 job types generated by interest women starting with their “dream” jobs on descending list of frequencies, and the same for men.
It mainly tells me what women didn’t have entry to in 1958.
Our world is more services than manufacturing.