Top 12 Viral Graphs Featured in The Nature-Nurture-Nietzsche Newsletter
The people have spoken


At the risk of sounding like a total nerd, there’s nothing I love more than a good graph. At their best, graphs do something words can’t: They distill complex ideas into a single visual punch. That’s why many of my favorite Nature-Nurture-Nietzsche Newsletter posts have centered on graphs. Here, I’ve collected 12 of the most viral graphs from the newsletter’s two-year history - the ones that most reliably stopped readers mid-scroll. From findings that challenge the received wisdom on gender and race to evidence that humans are still evolving, these are the visuals that provoked the strongest reader reactions. The people have spoken!
1. Victimhood as a Personality Trait
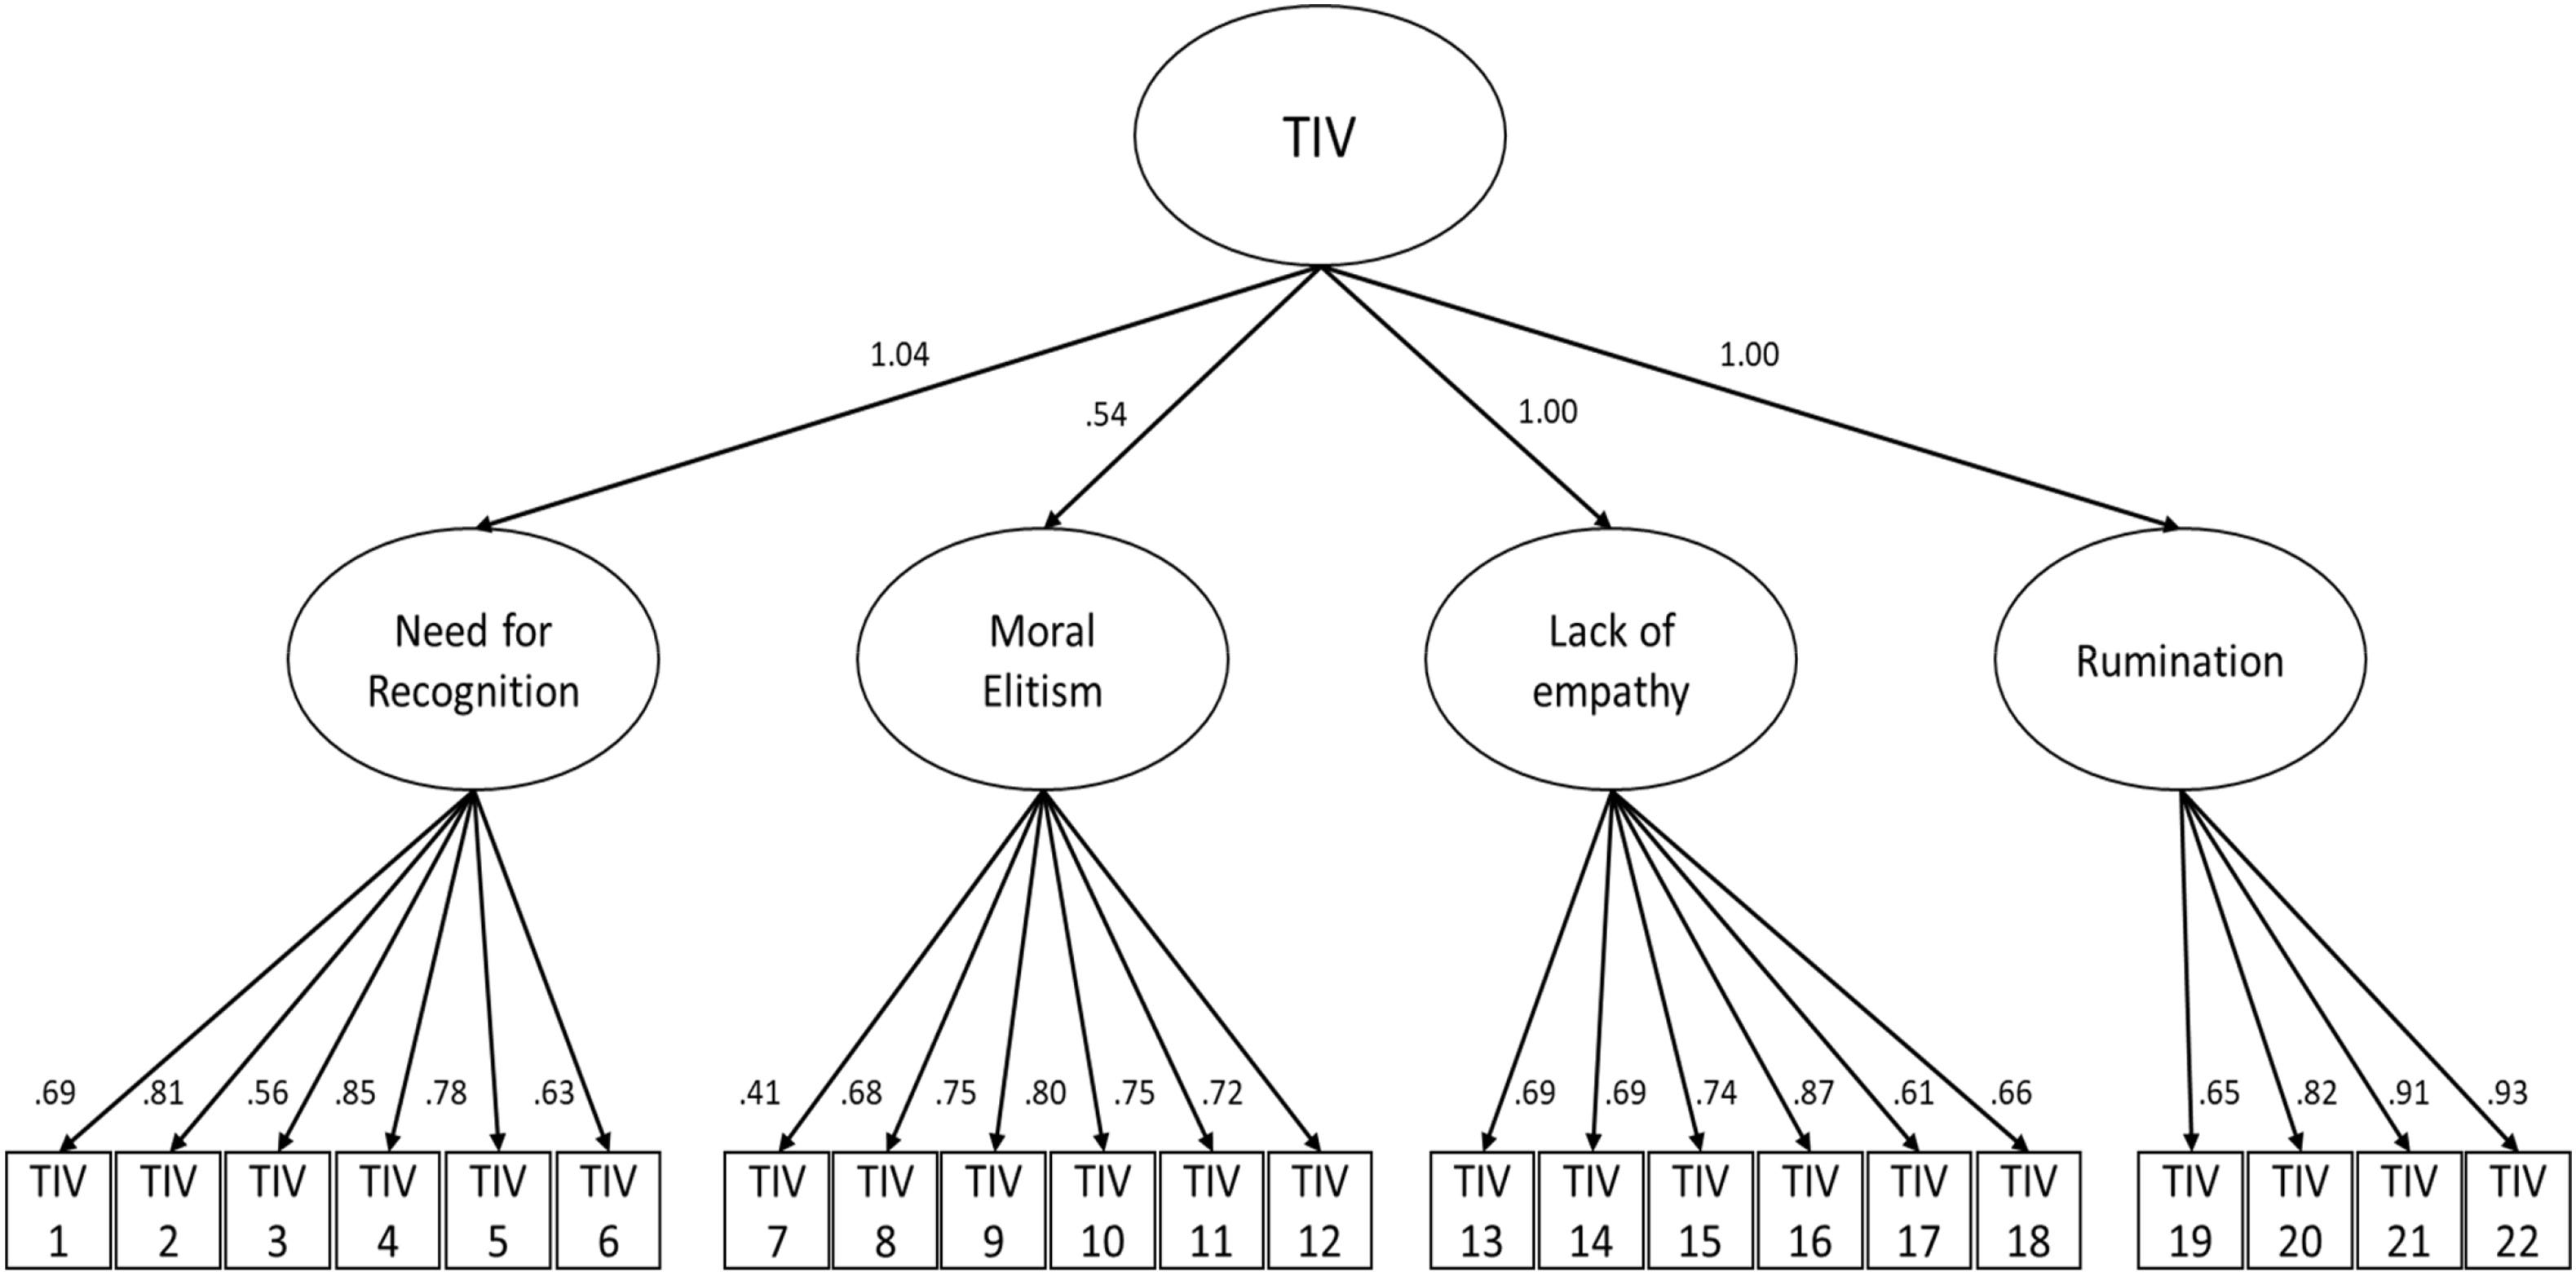
Psychologists have identified a personality trait they call the Tendency for Interpersonal Victimhood (or TIV). It reflects a chronic sense of being wronged by others, and includes four main components: the need for recognition as a victim, moral elitism, a lack of empathy, and rumination.
2. The Myth of Male-Only Voting Rights
Contrary to popular belief, the period of modern human history when men could vote but women couldn’t was relatively brief. For most of human history, no one could vote - not men, not women, not anyone.

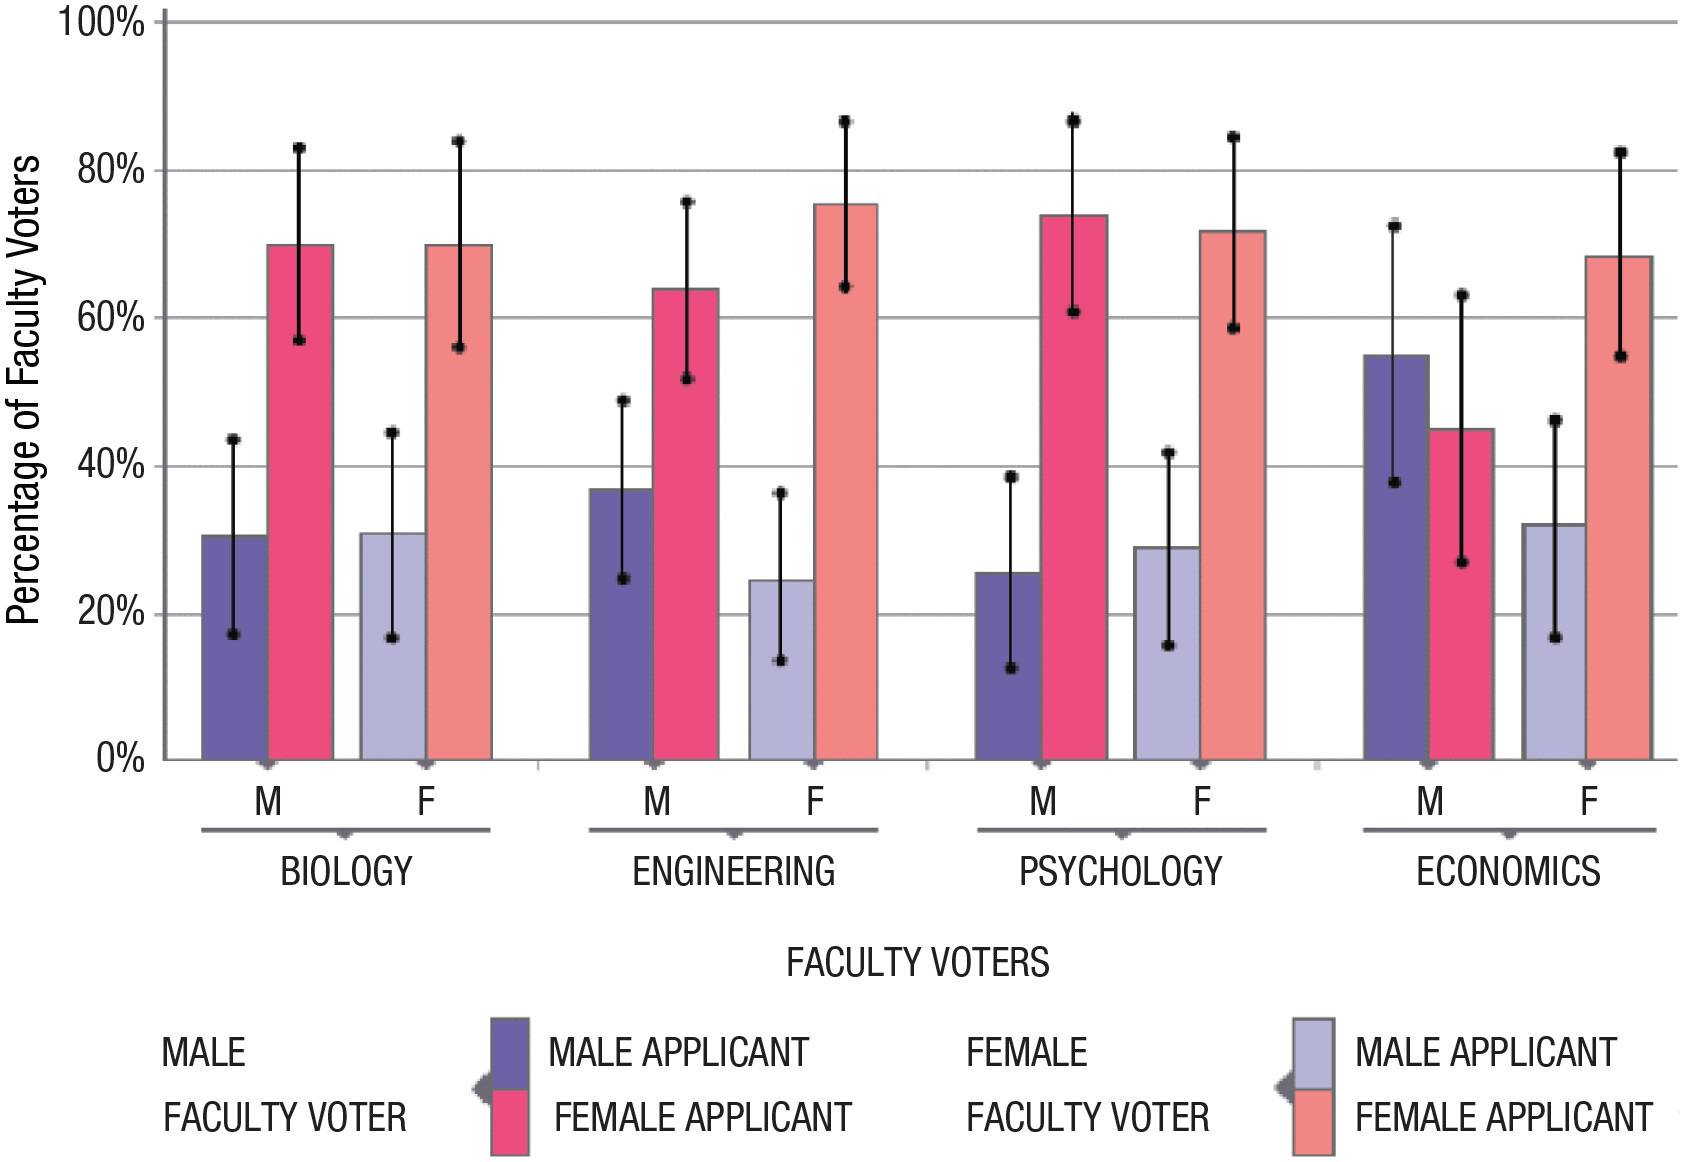
3. The Truth About Sexism in Science
Psychologists Wendy Williams and Stephen Ceci sent fake job applications to more than 800 US faculty members across four disciplines. The applications were identical, except for the sex of the alleged applicants. As shown in the graph below, faculty expressed a strong preference for the female applicants - a 2:1 preference overall. This fits nicely with real-world data suggesting that, although women less often apply for jobs in STEM fields, when they do, they’re more likely to get an interview and more likely to get the job.