The Activist Personality, Sex Differences in Sexual Desire, and Why Neanderthals Were Humans
The Nature-Nurture-Nietzsche Linkfest for January 2026


In Case You Missed It…
Sex Differences in Empathy Across Cultures [No paywall]
Welcome to the January 2026 edition of the N3 Newsletter Linkfest: a collection of links to papers and articles that grabbed my attention over the last month. On the menu today:
Why activists often score higher on narcissism and psychopathy
Why men evolved large penises - the largest among the primates
Three graphs that reveal key differences between men and women
New research on love, sex, and romance
Ants that get their nestmates to kill them
Five fascinating facts about animals to impress your friends with what a nerd you are
You can access the complete collection of Linkfests here.
Political Psychology
Participation in activist groups is associated with higher than average rates of narcissism and psychopathy. But which is cause and which is effect? A new longitudinal study suggests that both are both: People higher in narcissism and psychopathy are more likely to get involved in activist groups, but involvement in activist groups also leads to an uptick in narcissism and psychopathy. [Link.]
A recent study reveals that, in Europe, right-wingers are having more children than left-wingers - a pattern that could ultimately shift aggregate political opinion toward conservatism. [Link.]
Social Psychology
A survey of 60 nations finds that, in every one, people are convinced that morality is declining, and that this has been true for at least the last 70 years. The phenomenon is known as the illusion of moral decline. And yes, the authors make the case that it is an illusion. They point out that objective indicators of serious wrongdoing (such as violence and slavery) have declined over the centuries; that people’s perceptions of their contemporaries’ everyday moral behavior have changed little since the 1960s; and that cooperative behavior has increased, rather than decreased, over the same period. [Link.]

The Dr. House Effect: Experts are more persuasive when they’re impolite. If you don’t believe me, screw you. [Link.]
Personality Psychology
The graph shows the average personality profiles of fans of different book genres. [Link.]

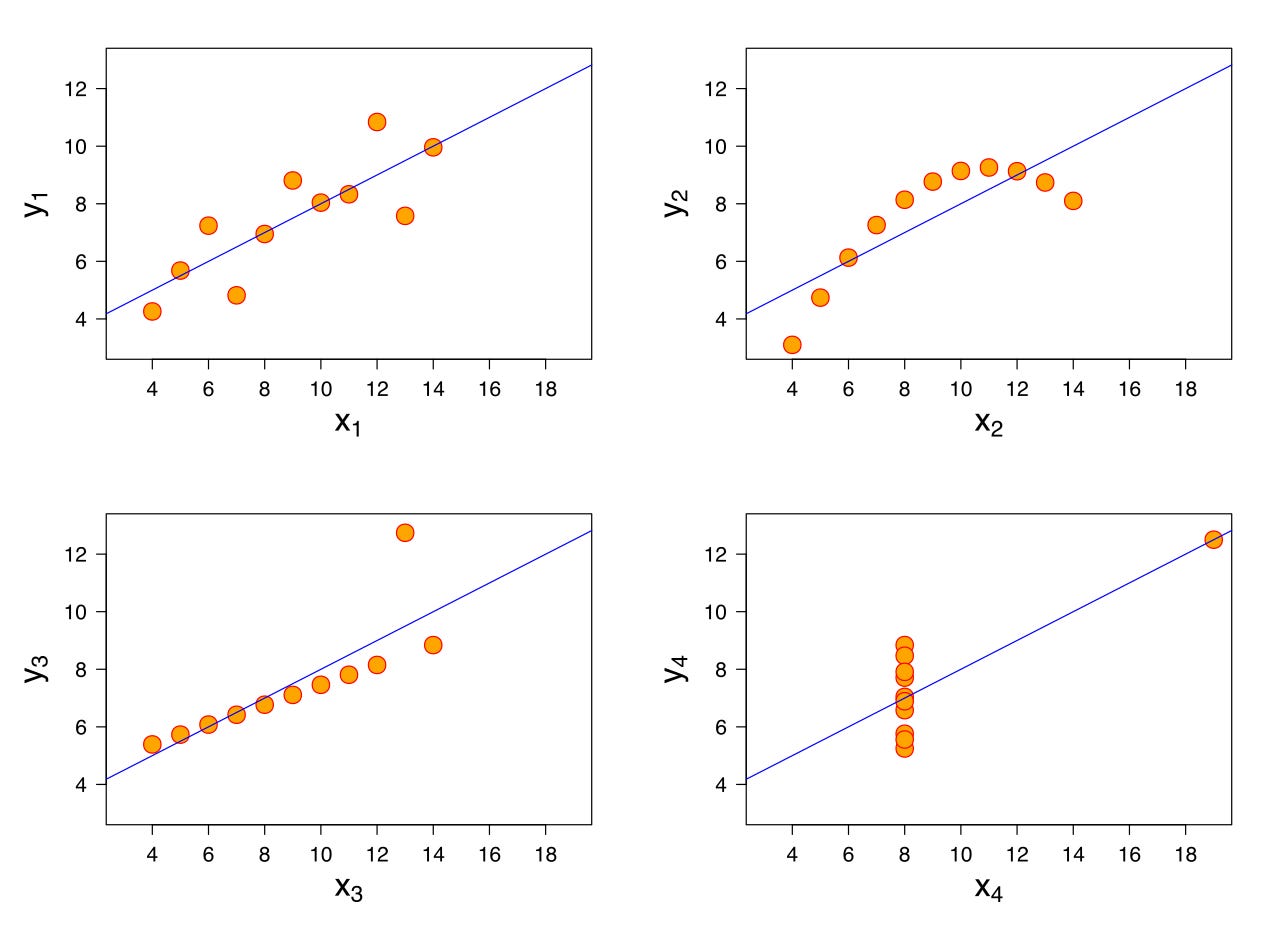
Stats 101
Your regular friendly reminder: These four datasets all have the same mean, median, and variance. Moral of the story: Always visualize your data! [Link.]
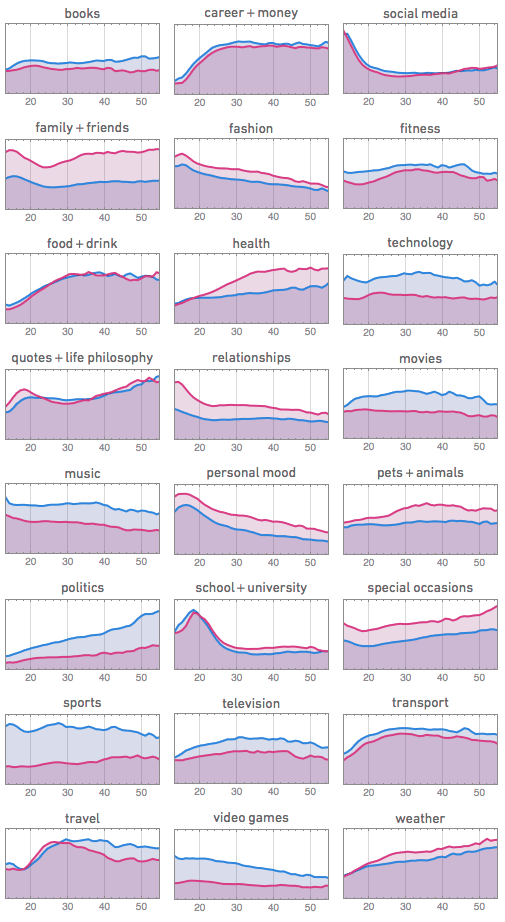
Three Sex Differences in Three Graphs
Graph #1 shows sex and age differences in what people talk about on Facebook. [Link.]